SESSION 2
THERAPEUTIC PROCESSES - II
Chairman: X. Deng
OPTIMIZATION OF TEMPERATURE DISTRIBUTIONS FOR REGIONAL HYPERTHERMIA BASED ON A NONLINEAR HEAT TRANSFER MODELa
Bodo Erdmann, Jens Lang, Martin Seebass
Konrad-Zuse-Zentrum für Informationstechnik Berlin ZIB, Department of Scientific
Software, Takustr. 7, 14195 Berlin-Dahlem, Germany.
E-mail: erdmann@zib.de
Hyperthermia, i.e., heating tissue to 42 43 oC, is a method of cancer therapy. It
is normally applied as an additive therapy to enhance the effect of conventional radio- or
chemotherapy. The standard way to produce local heating in the human body is the use of
electromagnetic waves. We are mainly interested in regional hyperthermia of deep seated
tumors. For this type of treatment usually a phased array of antennas surrounding the
patient is used (see FIGURE 1).
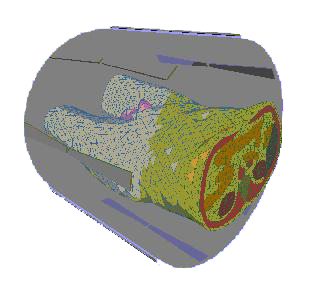
FIGURE 1. Patient Model (Torso) and Hyperthermia Applicator. The Patient is
Surrounded by 8 Antennas Emitting Radiowaves. A Water-Filled Bolus is Placed
Between Patient and Antennas.
The distribution of absorbed power within the patient's body can be steered by
selecting the amplitudes and Phase of the antennas' driving voltages. The space between
the body and the antennas is filled by a so-called water bolus to avoid excessive heating
of the skin.
From the viewpoint of computational medicine there are different challenges:
1. modelling and calculation of the electromagnetic field and the forced temperature, 2.
optimization of the channel adjustments to achieve favourable interference patterns for a
successfull cancer therapy, 3. visualization of vector fields and temperature distributions
on a very complicated geometry. All components have to be done for each individual
patient within a medical planning system.1
The purpose of our paper is to describe an optimization process based on a three-
dimensional nonlinear heat transfer model. It is a rather difficult task to establish an
appropriate physical model for the heat transport in the human body. Several approaches
can be found in the literature.2,3 The basis for our modelling is Pennes' bio-heat-transfer
equation4 which we equip with a temperature-dependent blood perfusion:
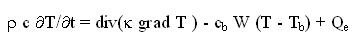
where r is the density of tissue, c and cb are specific heat of tissue and blood, k is the
thermal conductivity of tissue; Tb is the blood temperature; W is the mass flow rate of
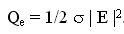
blood per unit volume of tissue. The power Qe deposited by an electric field E in a tissue with electric
conductivity s is given by
A similar two-dimensional model was studied for ferromagnetic thermoseed
hyperthermia.5
To start the optimization process a specially designed object function is defined.
Our aim is to get a temperature distribution which nearly avoids hot spots" in healthy
tissue and cold spots" in the tumor region. In order to derive a fast optimization we
approximate the nonlinear model by a sequence of linear ones which can be optimized
very fast by applying a superposition principle.
Adaptive finite element methods in space and linearly implicit integrators in time
with step size control are used to solve the nonlinear bio-heat-transfer equation.6 The
implementation requires modern software design and programming languages as C or
C++. Our code KARDOS is based on the programming environment KASKADE.7
Additionally, a comfortable visualization tool is invaluable. We used the graphical system
HYPERPLAN for the presentation of our numerical results.1
RESULTS
Our computations showed some effects which should be observable in the clinical data:
- The nonlinear model predicts that a significantly lower total power is needed to
achieve the optimal temperature distribution. In the simulations the total power is
always limited by the requirement that the temperature in healthy tissue should not
exceed 44 oC.
- The optimal parameters based on the nonlinear model differ significantly from those
obtained with constant-rate perfusion, they are in general closer to a symmetric
configuration.
- The nonlinear model predicts that a much larger amount of muscle tissue is heated to
above 40 oC. In spite of the fact that only a small number of temperature
measurements from inside the body is available, this effect might be visible in clinical
data.
The comparision of our results with real-life applications will lead to an assessment of the
parameters used in the nonlinear model.
REFERENCES
- Beck, R., P. Deuflhard, H.-C. Hege, M. Seebass, D. Stalling. 1996. Numerical Algorithms
and Visualization in Medical Treatment Planning, Preprint SC 96-54, Konrad-Zuse-
Zentrum für Informationstechnik Berlin, Germany.
- Kotte A., J. van Leeuwen, J. de Bree, J. van der Koijk, H. Crezee, J. Lagendijk. 1996. A
description of discrete vessel segments in thermal modelling of tissues, Phys. Med. Biol.
41, 865 - 884.
- Weinbaum~S., L.M. Jiji. 1985. A new simplified bioheat equation for the effect of blood
flow on local average tissue temperature, J. Biomech. Eng. Trans. ASME 107, 131-139.
- Pennes H.H. 1948. Analysis of tissue and arterial blood temperatures in the resting human
forearm, J. Appl. Phys. 1, 93 -122.
- Tompkins D. T., R. Vanderby, S.A. Klein, W.A. Beckman, R.A. Steeves, D.M. Frey, B.R.
Palival. 1994. Temperature-dependent versus constant-rate blood perfusion modelling in
ferromagnetic thermoseed hyperthermia: results with a model of the human prostate, Int. J.
Hyperthermia, Vol. 10, No. 4, 517 - 536.
- Lang J. 1998. Adaptive FEM for Reaction-Diffusion Equations, Appl. Numer. Math. 26,
105 - 116.
- Erdmann B., J. Lang, R. Roitzsch. 1993. KASKADE - Manual, Technical Report TR 93 -
105, Konrad-Zuse-Zentrum für Informationstechnik Berlin, Germany.
a The authors are indebted to Peter Deuflhard for his continuing support of this project. This work was
financed in part by Deutsche Forschungsgemeinschaft, SFB 273.
3-D TEMPERATURE DISTRIBUTION IN ULTRASOUND
HYPERTHERMIA WITH INTERSTITIAL WAVEGUIDE APPLICATOR
Boguslaw J. Jarosz
Carleton University, Ottawa-Carleton Institute for Physics, Ottawa, Canada K1S 5B6
ABSTRACT. Knowledge of temperature distribution in thermal treatment of cancerous tissue is of primary
importance for the therapy success. We discuss here finite element analysis approach to obtain 3-D temperature
pattern in ultrasonic heating with a four-waveguide-applicator array. Inclusion of shear component for phantom
heating improves significantly the simulation quality factor. We included it also in 3-D simulations for brain
tissue. The simulations for the tissue show that the perfusion remains a primary factor in defining the pattern.
1. INTRODUCTION
Interstitial hyperthermia in cancer treatment becomes important if there exists a concern
about heating sensitive nearby tissues or if energy deposition in the tumor is difficult because of its
location. Numerous experiments on porcine brain tissue in vivo and ex vivo, in animal tissues in
vitro and in tissue phantoms1 verified performance of a ultrasound (US) waveguide applicator. A
single applicator is useful for small volume heating. Heating with two to four applicators arrays2-3
in phantoms resulted in substantially larger, 16 - 65 cm3 volume. The temperature was detected in
these experiments at discrete locations. To get continuous temperature distribution, we used finite
element analysis (FEA) simulations. The original simulations were pseudo 3-D. They agreed well
with experiments but for a discrepancy near the applicators.
In this presentation we address two important issues. First, we look at the heat generation
in the vicinity of the applicators and explain how shear mode modifies the heat deposition.
Secondly, we present true 3-D temperature distribution and show the extent of temperature
elevation. We evaluate also the volume in which one can maintain the required temperature.
2. ANALYTICAL
Effective thermal conductivity equation (ECTE) is the basis for our FEA models. To
establish the model geometry, we briefly describe the US waveguide interstitial applicator. We
gave previously1 details of its design. US from piezoelectric transducer reaches the applicator's
needle via stainless steel truncated cones. They form the velocity transformer. A length of the
needle is inside a plastic cladding which is an acoustic insulator. The exposed part at the tip, an
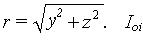
antenna, deposits the energy. We use R for radius of the antenna. The origin of Cartesian
coordinates is at the cladding termination with x axes along the needle axes. To obtain the
temperature pattern from the ECTE, we have to know the heat produced per unit volume in unit
time, i.e., volume specific absorption rate (SAR). Let <gi(y,z)>x be x averaged SAR for i-th
applicator. For N-applicator array the steady-state ETCE is
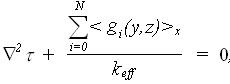 ...(1) ...(1)
 is the temperature elevation above basal To; keff is the effective thermal conductivity and is the temperature elevation above basal To; keff is the effective thermal conductivity and
  represents initial US intensity; a and m stand
for US power absorption and attenuation coefficients, respectively. Before, we assumed all the
US parameters for longitudinal waves. This resulted in simulation values always lower than
experimental at the antennas. Below we propose an approach to lessen the discrepancy. represents initial US intensity; a and m stand
for US power absorption and attenuation coefficients, respectively. Before, we assumed all the
US parameters for longitudinal waves. This resulted in simulation values always lower than
experimental at the antennas. Below we propose an approach to lessen the discrepancy.
In medical ultrasound shear component of oscillations was neglected because of its high
attenuation coefficient,  , and an assumption that tissue can not support shear components.
Estimates show that , and an assumption that tissue can not support shear components.
Estimates show that  can be as high as 150. Reports of cells ability to support stress waves
imply that shear component must be supported, too. We propose the following to evaluate shear
contribution. The amplitude of out-of-plane oscillations in Raleigh waves is about 1.5 of the in-
plane ones. The energy of in-plane (shear for the tissue) component is about 31% of the total
energy. Calculation for a moderate can be as high as 150. Reports of cells ability to support stress waves
imply that shear component must be supported, too. We propose the following to evaluate shear
contribution. The amplitude of out-of-plane oscillations in Raleigh waves is about 1.5 of the in-
plane ones. The energy of in-plane (shear for the tissue) component is about 31% of the total
energy. Calculation for a moderate  with longitudinal component SAR of 0.12 W/cm3
gave 2.5 mm as the shear component penetration depth. with longitudinal component SAR of 0.12 W/cm3
gave 2.5 mm as the shear component penetration depth.
3. RESULTS AND DISCUSSION
We have chosen Aquasonic 100 gel in 10.1-cm diameter acrylic cylinder as a phantom.
Eleven microthermistors served as the temperature sensors. An array of four applicators
separated by 24 mm provided the heating. The microthermistors were in the antennas middle
plane. In phantom simulations, we assumed zero temperature elevation at the base and the side
wall. We used three materials in the model: US gel, acrylic plastic and air layer. Fig.1 shows the
3-D results. To reveal details, the model was cut with planes perpendicular to coordinate axis.
The x-cut is in the antennas middle plane. The bands of 1 deg intervals are labeled by respective
temperature elevation. The simulation gave an improved 0.11oC for performance index.
We have carried out simulations for brain tissue at the base of the frontal lobe. The four-
applicator array had the same arrangement. We assumed 15-mm long antennas in model's one
layer. Below and above it, 20- and 25-mm-thick layers were added. To investigate blood flow
effects, keff was in 0.6-2.5 W/m/K range. The volume SAR was adjusted to reach the therapeutic
temperature. Fig. 2 gives the pattern for brain tissue. We used volume SAR = 0.25 W/cm3 and keff
= 1.0 W/m/K. The resultant temperature follows closely geometry of the array. Once again we
cut the model with three planes. Two planes are orthogonal to the x and y axis and the third is at
45o to z axes. Results for keff= 2.5 W/m/K show 42oC region disconnected and around three
applicators only. Thus the effects of shear component heating are secondary to perfusion. The
above shows the importance of this kind of simulations as a tool of thermal treatment planning.

FIGURE 1 Temperature elevation in tissue phantom
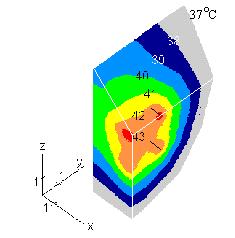
FIGURE 2 Simulated temperature elevation in brain tissue
REFERENCES
- Jarosz, B.J., IEEE Trans. Biomed. Eng., Vol. 43, No. 11, 1106-1115, 1996.
- Jarosz, B.J. and Kaytar, D., Proceedings, IEEE Instr. Meas. Soc. Int. Conf., Ottawa, ON, May 19-22, 1997.
- Jarosz, B.J. and Kaytar, D., IEEE Trans. Ultrason. Ferroelectrics Freq. Contr., in press.
|
