SESSION 6
MASS TRANSFER - II
Chairman: R. Collins
STRUCTURE AND GROWTH OF TUMORS: THE EFFECT OF CARTESIAN,
CYLINDRICAL, AND SPHERICAL GEOMETRIES
Rizwan-Uddina and Ibrahim M. Saeedb
a Department of Nuclear Engineering, University of Illinois, Urbana, IL 61801, USA (rizwan@uiuc.edu)
b School of Medicine,MCV, Virginia Commonwealth University, Richmomd, VA, 22903, USA
ABSTRACT
We present results of numerical simulations of a mathematical model simulating mass transfer
in the development of a tumor, resulting in its encapsulation and lobulation. Important
differences between one dimensional Cartesian, cylindrical, and spherical geometries are reported.
INTRODUCTION
A good understanding of tumor evolution is essential for the development of efficient prevention
and cure. Tumors, whether benign or malignant, are composed of two basic components: (1) cancerous
cells that constitute its parenchyma, and (2) supportive stroma made of connective tissue and blood
vessels. Benign tumors are often contained in a dense band (or capsule) comprised of compressed
connective tissue. Encapsulated benign tumors are either a continuum of tumor cells, or appear as
several lobes of different sizes, separated by a small amount of intervening connective tissue stroma,
all contained in a larger capsule. Cells of a malignant tumor, on the other hand, are not restrained
by a capsule. Development of artificial ways of inducing the encapsulation process, and hence
containing the spread of malignant tumor cells is desirable.1-3
Mathematical modeling of tumor growth has, in general, been restricted to simple models.4-6
Evaluation of tumor growth models was reported by Vaidya and Alexandro7. Recent
developments in the understanding of the convection-diffusion and reaction-diffusion equations,8,9
their application to mathematical biology,l0 and progress in numerical schemes to solve
these equations,ll has led to modeling of tumor growth as a reaction-diffusion process.l2-13
Perumpanani et al.13 developed and numerically solved two mathematical models in
one-dimensional Cartesian geometry to explain the formation of the capsule and the multi-lobular
nature of some tumors. In this study we extend the model used by Perumpanani et a1.13
in two specific ways. First we generalize the tumor cell generation term to simulate more complex
growth than is possible by the growth model used by them. Second, we carry out the simulations in
one-dimensional Cartesian, as well as cylindrical and spherical geometries. In certain cases,
as is shown below, the difference between the results for different geometries can be quite significant.
MODEL
The partial differential equations governing the balance of the tumor cells m(r,t), and
connective tissue c(r,t) are13

where g(m,c) is the generation term; b is a constant; n is 0, 1 or 2
for Cartesian, cylindrical and spherical geometries, respectively. Note that the convective tissue does
not diffuse-it is only convected by the diffusing tumor cells. The connective tissue flux is
proportional to the connective tissue concentration c(r,t) and the tumor cell flux Jm.
Parameter k is a key parameter in the model that represents the ability of the diffusing
tumor cells to convect the connective tissue. The first term on the right hand side of Eq. (1) is the
source or generation term, where g(c) = (1 - tanh[a1(c -a2)])/2.
NUMERICAL RESULTS
A simple explicit finite difference scheme with upwinding is used to solve the above set of PDEs
numerically. We have used Dx = 0.05 and Dt = 0.001. See Ref. 13 for details.
Calculations were performed in  with symmetric boundary
condition at r=0 for both m(r,t) and c(r,t) . As r
approaches infinity, both m(r,t) and c(r,t) should approach their initial values at
infinity. In numerical calculations, we make sure that the spatial domain is large enough that the
concentrations in a region at the rigit edge (r = rmax) of the spatial domain
do not change from their initial values at the end of the simulations. Distribution of m(r,t)
and c(r,t) for k =5 and b=2 at t=200 for the Cartesian, cylindrical
and spherical geometires are shown in Fig. 1. In Cartesian geometry (la), the distribution at t = 200 is a
sequence of thin regions (walls) of dense CT separated by tumor cells. Though the resulting structure
resembles a nodular tumor, unfortunately-unlike in nodular tumors-in Cartesian coordinates, the
innermost spike is the most dense, and the density at the first three spikes decreases with
increasing distance of those spikes from the origin. However, the evolution in the cylindrical
geometry (n = I) is somewhat different. The physical process is the same as in the Cartesian geometry,
but the cylindrical geometry effect leads to unevenly spaced spikes with mixed amplitudes.
Figure lb shows the m and c distribution as a function of r in cylindrical geometry
at t = 200. In spherical geometry (n = 2), Fig. lc, the innermost spike has the smallest
magnitude, mimicking the structure in a nodular tumor. Moreover the results with n = 2
also suggest that the lobes of tumorous cells are expected to be bigger near the center and
relatively smaller near the capsule. Additional results are presented in the complete paper. with symmetric boundary
condition at r=0 for both m(r,t) and c(r,t) . As r
approaches infinity, both m(r,t) and c(r,t) should approach their initial values at
infinity. In numerical calculations, we make sure that the spatial domain is large enough that the
concentrations in a region at the rigit edge (r = rmax) of the spatial domain
do not change from their initial values at the end of the simulations. Distribution of m(r,t)
and c(r,t) for k =5 and b=2 at t=200 for the Cartesian, cylindrical
and spherical geometires are shown in Fig. 1. In Cartesian geometry (la), the distribution at t = 200 is a
sequence of thin regions (walls) of dense CT separated by tumor cells. Though the resulting structure
resembles a nodular tumor, unfortunately-unlike in nodular tumors-in Cartesian coordinates, the
innermost spike is the most dense, and the density at the first three spikes decreases with
increasing distance of those spikes from the origin. However, the evolution in the cylindrical
geometry (n = I) is somewhat different. The physical process is the same as in the Cartesian geometry,
but the cylindrical geometry effect leads to unevenly spaced spikes with mixed amplitudes.
Figure lb shows the m and c distribution as a function of r in cylindrical geometry
at t = 200. In spherical geometry (n = 2), Fig. lc, the innermost spike has the smallest
magnitude, mimicking the structure in a nodular tumor. Moreover the results with n = 2
also suggest that the lobes of tumorous cells are expected to be bigger near the center and
relatively smaller near the capsule. Additional results are presented in the complete paper.
REFERENCES
- Dvorak, H. F. 1986. Tumors: Wounds that do not Heal-Similarities Between Tumor Stroma
Generation and Wound Healing. N. Engl. J. Med. 315: 1650-1659.
- Barr, L. C., R. L. Carter & A. J. S..Davies. 1988. Encapsulation of Tumors as a Modified Wound
Healing Response. Lancet. 135-137 , July 16, 1988.
- Barr, L. C. 1980. The encapsulation of tumours [MS Thesis]. University of Manchester.
Manchester, UK.
- Adam, J. A. 1986. A Simplified Mathematical Model of Tumor Growth. Math. Biosci. 81: 229-244.
- Adam, J. A. 1987. A Mathematical Model of Tumor Growth II: Effects of Geometry and Spatial
Nonuniformity on Stability. Math. Biosci. 86: 183-211.
- Adam, J. A. 1987. A Mathematical Model of Tumor Growth III: Comparison with Experiment.
Math. Biosci. 86: 213-217.
- Vaidya, V. G. & F. J. Alexandro, Jr. 1982. Evaluation of Some Mathematical Models for
Tumor Growth. Int. J. Bio-Medical Computing. 13: 19-35.
- Sachdev, P. L. 1987. Nonlinear Diffusive Waves. Cambridge University Press. Cambridge, UK.
- Newman, W. I. 1980. Some Exact Solutions to a Non-linear Diffusion Problem in Population
Genetics and Combustion. J. Theor. Biol. 85: 325-334.
- Murray, J. D. 1989. Mathematical Biology. Springer-Verlag.
- Rizwan-uddin. 1997. An Improved Coarse-Mesh Nodal Integral Method for Partial Differential
Equations. Num. Methods for Partial Diff. Equations. 12: 113-145.
- Sherrat, J. A. & M. A. Nowak. 1992. Oncogenes, Anti-oncogenes and the Immune Response to
Cancer: A Mathematical Model. Proc. R. Soc. Lond., B, 248: 261-271.
- Perumpanani, A.J., J.A. Sherratt & J. Norbury. 1996. Mathematical Modeling of Capsule
Formation and Multi Nodularity in Benign Tumor Growth. Warwick Preprint: 51/1996,
University of Warwick. Coventry, UK.

CONCENTRATION POLARIZATION` OF LOW DENSITY
LIPOPROTEINS (LDL)IN THE ARTERIAL SYSTEMa
Nasser Fatouraee,b,c Xiaoyan Deng,c,d Alain de Champlain,b
and Robert Guidoinc
b Department of Mechanical Engineering, Laval University, Qc, Canada G1K 7P4
cDepartment of Surgery, Laval University, Qc, Canada G1K 7P4 and Québec Biomaterials
Institute, Inc.,
Pavillon St-François d'Assise,CHUQ, Qc, Canada G1L 3L5
INTRODUCTION
The accumulation of cholesterol and other lipids within the intima is a preliminary
stage in the atherogenic process.1 These deposits are believed to be derived mainly from
plasma lipoproteins, and particularly low-density lipoproteins (LDL). Experimental
results2 suggest that the flux of LDL into the arterial wall is not regulated by endothelial
LDL receptors. Some cholesterol may seep into the arterial wall by infiltrating through
leaky endothelial cell junctions. This lipid infiltration should depend on the concentration
of lipids at the blood/vessel wall interface, as the blood vessel wall is directly exposed to
the luminal surface lipid concentration. Because of regional differences in the near-wall
blood flow velocity, blood pressure, and vascular permeability, the atherogenic lipid
concentration at the luminal surface may vary according to location in the arterial tree.
We therefore hypothesized that these local variations in the luminal surface lipid
concentration may contribute to the localization of atherosclerosis. To substantiate the
proposed hypothesis, we studied lipid transport from flowing blood to the arterial wall
under both steady-state flow3 and pulsatile flow conditions.
METHOD
To calculate the luminal surface concentration of LDL, the following assumptions
were made: (1) the fluid (blood) is homogeneous, incompressible, and Newtonian, with a
constant viscosity of 0.035 gr/cm.sec and a density of 1.05 gr/cm3; (2) the blood vessel is
a straight cylindrical tube with a uniform internal diameter; (3) the vessel wall is
permeable to plasma and has a filtration rate of the order of 10-6 cm/sec;4 and (4) the
convective and diffusive flux of LDL into the vessel wall are so small that their effect on
the luminal surface LDL concentration is negligible. The lipoprotein accumulation at the
luminal surface of the artery was determined by the balance between convective and
diffusive transport, and the no-slip and permeable wall conditions was applied at the
artery wall. At the inlet, the LDL concentration was assumed to be uniform. The blood
flow was reproduced by seventeen first harmonics of the flow waveform in the human
carotid artery.5 Fully developed velocity profiles corresponding to the pulse waveform
were calculated and used as the inlet boundary condition.
Under these conditions, the Navier-Stokes equations and a convective and diffusive
mass transfer equation were solved numerically. The flow field equations were made
discrete by the DuFort-Frankel Leapfrog method,6 and the Crank-Nicolson method, was
used to solve the time-dependent mass transfer equation.
RESULTS
Numerical simulations were carried out on human common carotid arteries with an
internal diameter of 7.0 mm and a time-averaged flow rate of 275 ml/min.5 The heart beat
rate was taken as 70/min. Under these conditions, the time-averaged Reynolds number
was 250 and the frequency parameter (Womersley number based on the fundamental
frequency), a was 5.2, and the normalized angular frequency,w was 0.2. The LDL
concentration was calculated for a filtration rate of 10-6 to 10-5 cm/sec and for a Schmidt
number of 1.67 x 10⁵ to 6.67 x 10⁵, corresponding to a LDL diffusion coefficient of
5.0 x 10⁻⁸ to 2.0 x 10⁻⁷ cm2/sec.7,8 The results revealed that under both steady-state and
pulsatile flow conditions, low molecular diffusivities of LDL led to a concentration
boundary layer at the vessel wall, in which the LDL concentration was apparently much
higher than the bulk concentration. The effect of the LDL diffusion coefficient on the
luminal surface LDL concentration, was studied by assuming that the filtration rate
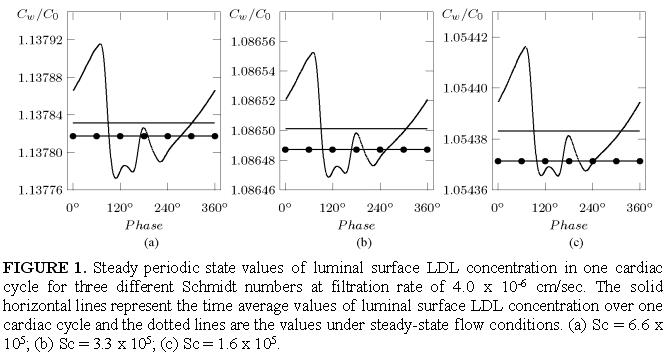
remained constant. FIGURE 1 shows the plot of relative surface concentration (steady
periodic state values) against time in one cardiac cycle. As shown in this figure, in one
cardiac cycle, there was a short period of time during which Cw /C0 was lower than the
value under steady-state flow. However, the time-average value was slightly higher than
that of corresponding steady flow case. FIGURE 2a presents the effect of the filtration rate
on the luminal surface LDL concentration. The time-average value of the dimensionless
luminal surface LDL concentration increased linearly with increasing filtration rate. In an
artery with a normal physiological filtration rate (4.0 x 10⁻⁶ cm/sec), the time-average
value of the luminal surface LDL concentration was 5 to 14% greater than that in the bulk
flow. FIGURE 2b shows the plot of relative time-averaged luminal surface LDL
concentration, Cw /C0, against time-averaged wall shear rate (flow rate),  . The relative
time-averaged luminal surface LDL concentration decreased sharply at low wall shear
rate and then approached a constant value asymptotically as wall shear rate was
increased. Similar to the steady state case,3 the relative time-averaged luminal surface LDL concentration was more sensitive to changes in flow conditions at low flow rates. . The relative
time-averaged luminal surface LDL concentration decreased sharply at low wall shear
rate and then approached a constant value asymptotically as wall shear rate was
increased. Similar to the steady state case,3 the relative time-averaged luminal surface LDL concentration was more sensitive to changes in flow conditions at low flow rates.

CONCLUSION
"Concentration polarization" of lipids may occur at the blood/arterial wall interface
under physiological pulsatile flow conditions. The luminal surface LDL concentration at
the arterial wall is flow-dependent, and varies linearly with the filtration rate through
the vessel wall and inversely with wall shear rate. This lipid transport phenomenon
within the circulation may have important implications for the pathogenesis and
localization of vascular disorders.
ACKNOWLEDGMENTS
The first author wishes to acknowledge the scholarship awarded by the Ministry of
Culture and Higher Education of Iran. The technical assistance of Claire Kingston was
appreciated.
REFERENCES
- Stary, H.C. 1989. Evolution and progression of atherosclerotic lesions in coronary arteries of
children and young adults. Arteriosclerosis 9 (Suppl I): I19-I32.
- Wiklund, O., T.E. Carew & D. Steinberg. 1985. Role of the low density lipoprotein
receptor in penetration of low density lipoprotein into rabbit aortic wall. Arteriosclerosis 5:
135-141.
- Deng, X.Y., Y. Marois, T. How, Y. Merhi, W.M. King & R. Guidoin. 1995. Luminal
surface concentration of lipoprotein (LDL) and its effect on the wall uptake by canine carotid
arteries. J. Vasc. Surg. 21: 135-145.
- WILENS, S.L. & R.T. MCLUSKEY. 1952. The comparative of filtration properties of excised
arteries and veins. Am. J. Med. Sci. 224: 540-547.
- Bharadvaj, B.K., R.F. Mabon & D.P. Giddens. 1982. Steady flow in a model of the human
carotid bifurcation. Part I-flow visualization. J. Biomech. 15: 349-362.
- Roache, P.J. 1972. Computational Fluid Dynamics. Hermosa Publisher, Albuquerque.
- Caro, C.G., J.M. Fitz-Gerald & R.C. Schroter. 1971. Atheroma and arterial wall shear:
Observation, correlation, and proposal for a shear dependent mass transfer mechanism for
atherogenesis. Proc. Royal. Soc. Lond. B117: 109-159.
- Back, L.H. 1975. Theoretical investigation of mass transport to arterial walls in various blood
flow regions - I. Flow field and lipoprotein transport. Math. Biosci. 27: 231-262.
aThis work was supported by a grant from the Whitaker Foundation.
dAddress for correspondence: Dr. Xiaoyan Deng, Québec Biomaterials Institute, Inc., Pavillon
Saint-François d'Assise, Laval University, 10, rue de l'Espinay, Québec, Canada G1L 3L5. Phone,
418/525-4485; Fax,418/525-4372; e-mail, x.deng@crsfa.ulaval.ca
THE CELL TYPE SANDWICH CONSTRUCTION FOR HUMAN BLOOD PLASMA POLARIZATION
MICROSCOPY - THE MEDICINE ENGINEERING AND THE RESULTS OF THE
INVESTIGATIONS
V.Zaitsev*, N.Zaitseva**
* Ivanovo State University, Yermaka Str., 39, Ivanovo, RF
** Ivanovo Cardio Centre, Engelsa Str., 22 , Ivanova, RF
KEYWORDS
Textural Characteristics, Polarisation Microscopy, Dendrites, Genetic, Ozone, Aerosol, Oxygen,
Biocolloid.
The free radical peroxidation of the lipids was carried out in vitro in the aerosol regime by
passing through them ozone-oxygen mixture, which was obtained in a barrier discharge reactor
from the 1,5 % ozone. Systematic investigations of the blood plasma from the donors (20 test) and
patients with myocardial infarction (50 test) were carried out. Textural characteristics (1) were
received in the flat capillaries of the "sandwich" type (2) and were revealed on the polarisation
microscope MIN-8. The flat capillary had the square ~ 1 sm2 and thickness ~ 0,01 nm. The inner
surface of the flat capillary in the glow discharge reactor was covered by a thin polymer film with
the surface tension coefficient (2), that had regulating polar and dispersion constituents. The value
polar and dispersion constituents were defined by the solution of the equation system on a computer.
The optical parameters of the blood plasma were registered in the range 500-4000 sm-1 (on device
Specord-80M) and 10-600 sm on Furrier spectrometer with computing complex. The phase transition
temperature in the model cellular-vesicular structure (gel-liquid crystal state) was defined from
dependence on conductivity within co-ordinates (logarithm of electrical conductivity of blood
plasma - 1/T [Kelvin-1]). The results of the model experiments in vitro were compared with the
effects of the medicinal antioxidants in vivo.
It was stated, that when are changing the current in the reactor of glow discharge (0-10-2 A), the
processing time of capillary (0-5400 sec), the flow speed of the mixture gentle gas-monomer
(methacryl acid and others) V=(2,5-5,0)*10-3 H/m, under gsd:gsp=1-10. The surface energy was
calculated as:
WSL= [(gsp)1/2-(gap )1/2]2 + [(gsd )1/2- ( gad)1/2]
Craft points placement was defined by scan calometry method. Some results of the
investigations of the lipids radical peroxide oxidation influence are shown on the figures 1,2.
With the removal of the water from the flat capillary, the dendrites, spherolytes, fan- and
needle-shaped crystals in the solid phase were registered in the blood plasma at patients with
myocardial infarction and the lines of liquid crystals at donors. It was indicated, that the maximal
speed of crystallisation (up to 0.2 mm/sec) was on the layers with state gsd:gsp=10. The layers of this
quality at the first time helped to receive the pseudo isotropic textures with size up to 10 mm of the
cellular type in the lamella phase in the flat capillary. The textures of the regular pentagonal and
hexagonal shape with 90o (rotation of the polarisation plane of the membrane wall with meeting in
the node under angle 120o (are presenting especial interest. In our opinion, it is connected with
rotational isomerisation (rot[+] and conformation rot[-]) as well, as with the weak interaction of
non-polar biomolecular groups and their location in the dodecahedral regions in the combination
with the cavities of 14-hedrons, forming clatter - similar solution. The textural research complies
with the results of the biochemical and spectral analysis. The Furrier-spectroscopy helped to specify
the stratification of the biocolloid and the breaking hydrogen connections during dismethabolism. The metabolic disorder in
case of myocardial infarction, the simulation of peroxide oxidation of the lipids by the ozone
treatment of the blood plasma in vitro and the action of the antioxidants in vivo are fixed in the
infrared spectrum by changing the line intensifies of non-saturated connections of the arachidonic and
linolenic acids -C=C-C=C- (l~1680-1580; 1070 sm-1) and catabolism products groups =COC=
(l~3050-2990 sm-1), -C=C- (l~2140 sm-1). The analysis of the lines -P-O-C6H5 (l~1240-1990 sm-
1) and -P-O-R (l~196001940 sm-1) is promising. The changing of the spectra intensity and breaking
the regular textures during ozone treatment with the rising of total area of the optically active groups,
allow to make a conclusion, that the ability of a blood plasma to the lyomesomorphism and
structuring indicates the infringement of recyclation of the membrane material and of metabolism.

Figure 1 The influence of free radical oxidation of lipids on the Craft points placement:
- Donor's blood plasma;
- Blood plasma + 120 relative points of O3
The human blood plasma proteins realise creating bonds mean the information transfer,
influencing on the genetic mechanism of the cell. Every aminoacids are according from 1 (Met, Trp)
to 6 (Leu, Arg, Ser) of the codones (the code which has the abundance properties) (the table 1). It
was found that the needle crystal textures of the blood plasma of the patients with myocardial
infarction, in the case closer to death are characteristic of the aminoacids textures too. The high
sensitivity of the polarising microscopy method let to recommend the methods as a one from the long-
term other methods of the genetic breaches find.
Table 1. The aminoacids, its conventional signs, (three and one letter symbol) and the codones are
according to them, the crystal type.

The investigations of the temperature dependence of the conductivity (lgs-1/T) at the different
degrees of the plasma ozone treatments in vitro helped to show for the first time the quantitative
influence of the lipids peroxide oxidation on the conductivity [lgs=(-10.5)-(-9.7)] as well, as more
abrupt phase transition in the temperature range [1/T=3.15-3.09 K-1].
ACKNOWLEDGEMENTS
We would like to thank N. Kaledenkova for her help to carry out the experiment and A.Kochetov and
A.Wyrleiev for their help to put into the form this paper.
REFERENCE
- Zaitsev V.V., Zaitseva N.B., Usol'tseva N.V. Orientation of Lyotropic Liquid Crystals of Blood
Plasma // Colloid Journal (Russia), 1996; 58; 713-716.
- Zaitsev V.V., Zaitseva N.B., Usol'tseva N.V. The Textures of the Biological Liquid Crystals of a
Patients with Myocardial Infarction // Academy of Science News (Russia), 1996; 60; 115-118.
|
