SESSION 7
CRYOBIOLOGY - I
Chairman: M. Toner
RESPONSE OF A LIVER TISSUE SLAB TO A HYPEROSMOTIC SUCROSE BOUNDARY CONDITION:
MICROSCALE CELLULAR AND VASCULAR LEVEL EFFECTSa
Sankha Bhowmickb, Chaouki A. Khamisb and John C. Bischofb,c
bDepartment of Mechanical Engineering, University of Minnesota, Minneapolis, 55455, USA.
INTRODUCTION
Cryopreservation of cells and tissues require the pre-loading of these systems with chemical
additives called CPAs (cryoprotective agents). The addition and removal of CPA from single cells
is fairly well understood and can be both measured with microscopy techniques and modeled with
irreversible thermodynamics as expressed in the equations of Kadeem-Katchalsky1. However,
there are still several challenges to modeling CPA transport in tissue systems, where unlike the
single cell, the membrane is only one of many resistances to transport faced by the CPA which
must ultimately enter the cell cytoplasm. In particular, the CPA must be transported through the
tissue a certain distance before arriving at a particular cell membrane. This transport and the
corresponding cell osmotic excursion, once the CPA effects are felt at a particular cell, are difficult
to measure and predict.
The purpose of this work was to obtain suprazero water transport data from the measurement
of volumetric shrinkage response of cells within an optically thick whole tissue slice exposed to a
hyperosmotic, non-permeating CPA, sucrose. We then try to explain the dynamics of cellular and
vascular volume changes by mathematical modeling which includes various resistances to sucrose
diffusion in the tissue matrix.
THEORY AND MODELING
Two models for the transport of sucrose through the tissue via an extracellular/ vascular
pathway were developed using a Krogh cylinder approach. For a one dimensional Cartesian case
the general species transport equation can be written

The first model proposes that sucrose transport into the tissue and subsequent cellular changes
can be interpreted by an effective diffusivity of species 1, sucrose. Since there is no reaction,
equation 1 then reduces to
A second model was proposed which assumes that water entering the vasculature from
cellular dehydration due to increased sucrose concentration leads to a bulk convective flux towards
the boundary of the slice. The Starling's equation is used to describe cellular dehydration due to
osmotic pressure difference created by sucrose in the vasculature similar to the freeze induced
dehydration as previously described3. The diffusion of sucrose into the tissue is thus coupled to
convection of water out of the tissue, due to dehydration. Equation 1 is rewritten for sucrose, with
no reaction, and it reduces to:

The two models are implemented numerically using a finite difference discretization scheme.
Boundary conditions included a constant sucrose concentration at one boundary and symmetry at
the centerline. The initial condition was zero sucrose concentration throughout the tissue.
MATERIALS AND METHODS
Experiments were performed on freshly excised livers from Sprague Dawley male rats (175-
200g), (Harlan Sprague Dawley, Inc., Indianapolis, Indiana). Thin (~500µm) tissue slices were
subject to a hyperosmotic sucrose solution at 2°C (0.3M or 0.6M) for different time periods, and
slam frozen immediately after the experiment in liquid nitrogen. The tissue samples were then
freeze substituted,2 embedded in resin, sectioned and imaged under a light microscope fitted with a
digitizing system3.
RESULTS AND DISCUSSION
Image analysis of cellular and vascular/extracellular volumes was performed with NIH Image
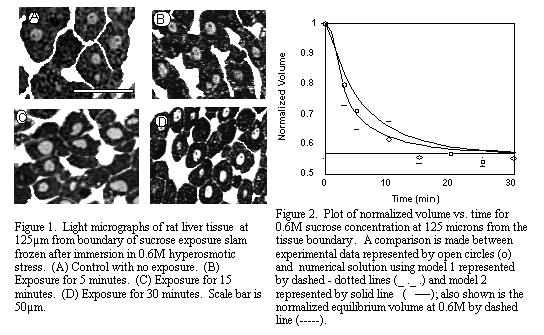
softwareTM (NIH, Bethesda, MD) to ascertain cellular and vascular volume over time. Figure 1
shows the morphology of the liver tissue after 0, 5, 15, and 30 minutes of exposure to 0.6M
sucrose solution at 125µm from the constant sucrose concentration boundary. As shown in the
figure, individual hepatocytes appeared as a clump of dark stained polygonal structures with gray
round nuclei. The large white continuous areas between the cells correspond to the
vascular/extracellular space (predominately vasculature, 10.6% plus some interstitium, 4.9%).
The micrograph shown in Figure 1A gives a view of the liver cells in their control (normal) size
prior to sucrose dehydration. The micrographs in Figure 1(B, C, D) demonstrate the dehydration
trend exhibited by the continuous reduction in the areas of the cells as exposure time to hypertonic
stress is increased. In addition there was a change in the vascular volume too (denoted by the white
regions in the micrograph).
Figure 2 represents a comparison between the experimental and numerical data for 0.6M
sucrose at 125µm from the tissue boundary. The normalized cell volume on the y-axis is plotted
against minutes of immersion in the hypertonic sucrose solution on the x-axis. Experimental data
is represented by open circles, numerical solution using the first model is represented by a dashed-
dotted line, where Deff was estimated by the eye and had R2 > 0.97, and the normalized
equilibrium volume for a cell exposed to hypertonic 0.6M sucrose environment by a dashed line.
Deff jumps from a value of 0.16Dsucrose at 0.3M (data not shown) to 0.33Dsucrose at 0.6M.
These changes in effective diffusivity may be a reflection of the varying void fraction and
tortuosity of the tissue during cellular dehydration and vascular engorgement, thereby changing the
effective diffusivity4. The incorporation of these geometric changes inside the tissue appear to play
an important role in the hindered transport of sucrose and need to be incorporated into future
modeling attempts.
The second model is represented on the graph by a solid line. It tries to explain the hindered
diffusion of sucrose and corresponding cellular shrinkage in a tissue, by incorporating the effect of
convecting water which leaves the cells. The model captures the nature of the volumetric shrinkage
of the cells, being able to predict them within the error bars of the experimental value. However,
the 0.6M case underpredicts the volumetric shrinkage response in contrast to the results obtained
from 0.3M sucrose (data not shown), where volumetric shrinkage is overpredicted. This may be
an indication that factors in addition to convection, such as vascular compliance, need to be
incorporated for better prediction of the experimental results in future models.
CONCLUSION
Transport of a non-permeating CPA in liver tissue was studied by experimental and theoretical
techniques. The system consisted of a 20mm x 15mm x 500µm (thick) slab of liver tissue which
was exposed to culture media and hyperosmotic sucrose (0.3 or 0.6M) at the boundary. The
volumetric changes of cell and vascular spaces within the tissue slab at 125µm from one of the
symmetric boundaries was studied by slam freezing followed by freeze substitution microscopy.
The experimental data was then theoretically investigated using two models; one based on an
effective diffusion coefficient for sucrose, and another which incorporated the convective flux of
water out of the cells (and the tissue) while sucrose diffuses in. We estimate the effective diffusion
of sucrose as 16-33% of the actual diffusivity of sucrose in bulk water. The role of convection of
water out of the tissue is against the flow of sucrose and appears to be important in reducing the
effective diffusivity of the sucrose. Moreover, vascular compliance, porosity and tortuosity are
important factors that need to be considered while modeling transport in tissues.
REFERENCES
- Mcgrath, J.J. 1988. Chapter in Low Temperature Biotechnology: Emerging applications and
Engineering contributions, J.J. McGrath and K.R. Diller eds, ASME BED 10: 273-330.
- Robards, A.W., & Sleytr, U.B. 1985. In Low Temperature Methods in Biological Electron
Microscopy. (Chapter 7) Elsevier, 10.
- Pazhayannur, P.V., & Bischof, J.C. 1997. Measurement and simulation of water transport
during freezing in mammalian liver tissue, ASME Journal of Biomechanical Engineering 119:
269-277 .
- Geankoplis, C.J. 1993. Transport Processes and Unit Operations, Prentice Hall, Engelwood
Cliffs, N.J., 3rd. ed.: 412-413.
a This work was supported by a grant from Whitaker foundation to JB.
c Address for correspondence: Department of Mechanical Engineering, University of Minnesota,
Minneapolis, MN, 55455, USA. Phone, 612-625-5513; fax, 612-624-5230.
ANALYSIS OF MASS TRANSPORT DURING
WARMING OF CRYOPRESERVED CELLS
Alexander V. Kasharin and Jens O.M. Karlsson
Department of Mechanical Engineering, University of Illinois, Chicago,
Illinois 60607, USA
As a first step towards developing mechanistic models of damage to
cryopreserved cells during the warming process, an analysis of water
transport during warming was undertaken. With the aim of identifying
regimes in which conventional two-compartment, membrane-limited water
transport models will be valid for predicting cell dehydration/rehydration
during warming, the Peclet number was evaluated. Simulations showed
that Pe » 1 during the early stages of warming, indicating that transport
was rate-limited by diffusion to and from the membrane. However, by
comparing the time-scale of transport to the time-scale of the warming
process, it was possible to identify conditions in which the membrane-
limited transport model would yield adequate predictions in diffusion-
dominated regimes. Simulations suggested that a membrane-limited
model would fail during slow warming of rapidly cooled cells, but that it
would perform adequately if cooling was slow, or if warming was rapid.
METHOD OF DESIGNING PRE-FREEZING PROTOCOL IN
CROYOPRESERVATION OF BIOLOGICAL MATERIALS
Ryo Shirakashia and Ichiro Tanasawab
a Institute of Industrial Science, University of Tokyo, 7-22-1 Roppongi, Minato-ku,
Tokyo 106, Japan
b Tokyo University of Agriculture and Technology, Faculty of Engineering,
Mechanical Systems Engineering, 2-24-16 Naka-cho, Koganei, Tokyo 184, Japan
ABSTRACT
Procedures of determing the pre-freezing protocol in
cryopreservation of biological materials are discussed. In order to
cryopreserve biological materials, especially tissues with large sizes,
the concentration of cryoprotective agents (CPAs) should be high
enough after pre-freezing process, because a high concentration
CPA solution can be vitrified a rather low cooling rate. In the pre-
freezing process, the concentration of CPA is raised gradually to
avoid osmotic stress. In this paper, a conventional method of
designing the pre-freezing protocol is proposed. The rate of increase
of the concentration of CPA can be calculated on the basis of
Kedem-Katchalsky equations using the membrane permeabilities,
Lp, w and s. Optimal protocol can be determined by calculating a
process in which the normalized volume of the cell is kept constant
whole through the process.
INTRODUCTION
To cryopreserve successfully a biological material, especially a tissue with large size,
one would rather avoid the deleterious effects of cooling rate. When the cooling rate is
lower, the cells composing biomaterial suffer from solution effect or mechanical stress
caused by extracellular ice crystals. On the other hand, when the cooling rate is higher,
intracellular ice is nucleated which might break the cell membrane mechanically. These
phenomena suggest that only a certain narrow range of cooling rate permits high viability
of cryopreserved cells. Many researchers use CPA to get over this trend. Vitrification is
the ideal method, because the deletrious effects of cooling rate in the freezing process is
negligeble by avoiding ice nucleation. Fahy, MacFarlane, Angell and Meryman1 showed
that the glass transition occur even at a low cooling rate, if the concentration of CPA is
high enough (for glycerol around eutectic point). But, to introduce such a high
concentration CPA into cells, as well as into a tissue, is so difficult that efforts such as
searching new CPA (low viscosity, low toxicity), adding a pressure during freezing
process are made to reduce the concentration of CPA which can vitrify. In any case,
CPA should permeate through the membrane of cells without suffering from osmotic
shock. To avoid the possible effect of the osmotic pressure induced by a sudden change
of concentration of CPA, it might be effective to raise the concentration of CPA
gradually2. Moreover, pre-freezing protocol should be finished in a short period, because
the longer the pre-freezing period, the more degenerate biomaterial might be .
This paper proposes a method to design pre-freezing protocol using the membrane
permeabilities and size of cells, using Kedem-Katchalsky (K-K) equation as fundamental
equation. Similar researches were made by R. Levin and T.W. Miller3. We tried to
simplify the method of design, moreover, to assess whether the designing principle is
usable by applying the method to endothelial cells of porcine arteries.
DESIGN CONCEPT
As the large difference of concentration between intracell and extracell gives osmotic
stress, it might be effective to change concentration of CPA continuously. By solving K-
K equation numerically, the volume change of a cell can be predicted. Optimized profile
can be calculated by keeping bmin larger than bcri which is the normalized equilibrium
volume. According to the numerical calculation, the volume flux across the membrane
is nearly 0 through the pre-freezing process, that is, K-K equation can be simplified to
eqs. (1) as below.
Coa=Coa0+[waRT(1-blim)]/[sa(blim-e)2]*C1e0*(S0/V0)*(t-tmin) (1)
It is clear that among three membrane permeabilities, wa and sa is important for
optimizing the rasing rate of concentration.
PRE-FREEZING PROCESS OF PORCINE ARTERIES
To examine fundamental equations for design, porcine arteries were immersed in
glycerol solution of different concentrations, followed by estimation of viabilities of
endothelial cells. Two kinds of protocols were taken place. Viabilitiy which was
assessed by means of dye-exclusion test4 after each pre-freezing process is compared
with corresponding bmin calculated. The result shows a possibility of predicting damage
depends on pre-freezing protocol, so that design of optimal profile for pre-freezing
process might be possible. However, estimation of damaged cells should be quantified
more clearly, and also more reliable values of the membrane permeabilities and critical
cell volume bcri are required.
NOMENCLATURE
C : Concentration (mol/m3)
b: Cell volume ratio (m33)
R : General gas constant (J/(mol K) )
S :Surface area (m2)
t : Time (sec)
T : Temperature (K)
V : Volume (m3)
J : Flux through cell membrane ( mol/m2, m3/m2 )
Lp : Hydraulic conductivity (m3/(N sec) )
w: Solute permeability coefficient (mol/(N sec) )
s: Reflection coefficient
e: Non-osmotic volume fraction at noramilized osmolarity
I : Level of brightness
E : Mean value
V : Deviation
Subscript and Superscript
a : Cryoprotective agent
e : Electrolyte
o : Extracell
i : Intracell
0 : Initial state
V : Volume
cri : Critical value
lim : Minimum limit value
min : Minimum
rex : Relaxation
x : Axis along radius direction of a artery
y : Axis along axial direction of a artery
REFERENCES
- Fahy, G. M., D. R. McFarlane, C. A. Angell & H.T. Meryman. 1984. Cryobiology 21:
p.407
- Fahy, G. M., & S.E. Ali. 1997. Cryobiology 35: p.114
- Levin, R. L., & T.W. Miller.1997. Cryobiology 18: p.32
- Imahori, K., & T. Yamakawa et al. Eds. 1990. In Dictionary for Biochemistry (Seikagaku -
jiten), 2nd Ed., published by Tokyo kagaku do-jin : p.576, p.934 ( in Japanese)
|
