|
Session 4
APPLICATIONS
Chairman: E. Leonardi
NUMERICAL PREDICTION OF AXIAL COMPRESSOR STATOR-WELL FLOWS
Ozturk H.K., Turner A.B. and Childs P.R.N.
Thermo-Fluid Mechanics Research Centre
School of Engineering, University of Sussex, Brighton BN19QT, U.K.
The design of many high bypass ratio aircraft gas turbines is currently limited by high metal temperatures caused by parasitic windage heating in the high pressure compressor. The problem will be exacerbated with the next generation of large turbofan engines currently under consideration since the compression ratio of these will approach 60:1 with compressor delivery temperatures of 1000K or so. Turbine type refractory alloys, rather than titanium alloys, are now routinely used for the blades and discs of the last few compressor stages but, even so, parasitic windage heating can create temperatures of l00oC above the compressor mainstream temperature and cause thermal distortion and, possibly, catastrophic damage.
In many axial gas turbine compressors, shrouded stator blades are used to eliminate vibration and to control tip leakage. The stator blades with this design are interlocked with the hub shroud and, so that the main annulus gas flow is not obstructed, a trench or "stator-well" is provided in the rotor underneath the stator blade row. This forms two rotor-stator cavities, one upstream and one downstream on either side of a labyrinth seal on the rotor which controls the leakage flow. Figure 1 shows a few of stator-well geometries in a modern high pressure gas turbine.
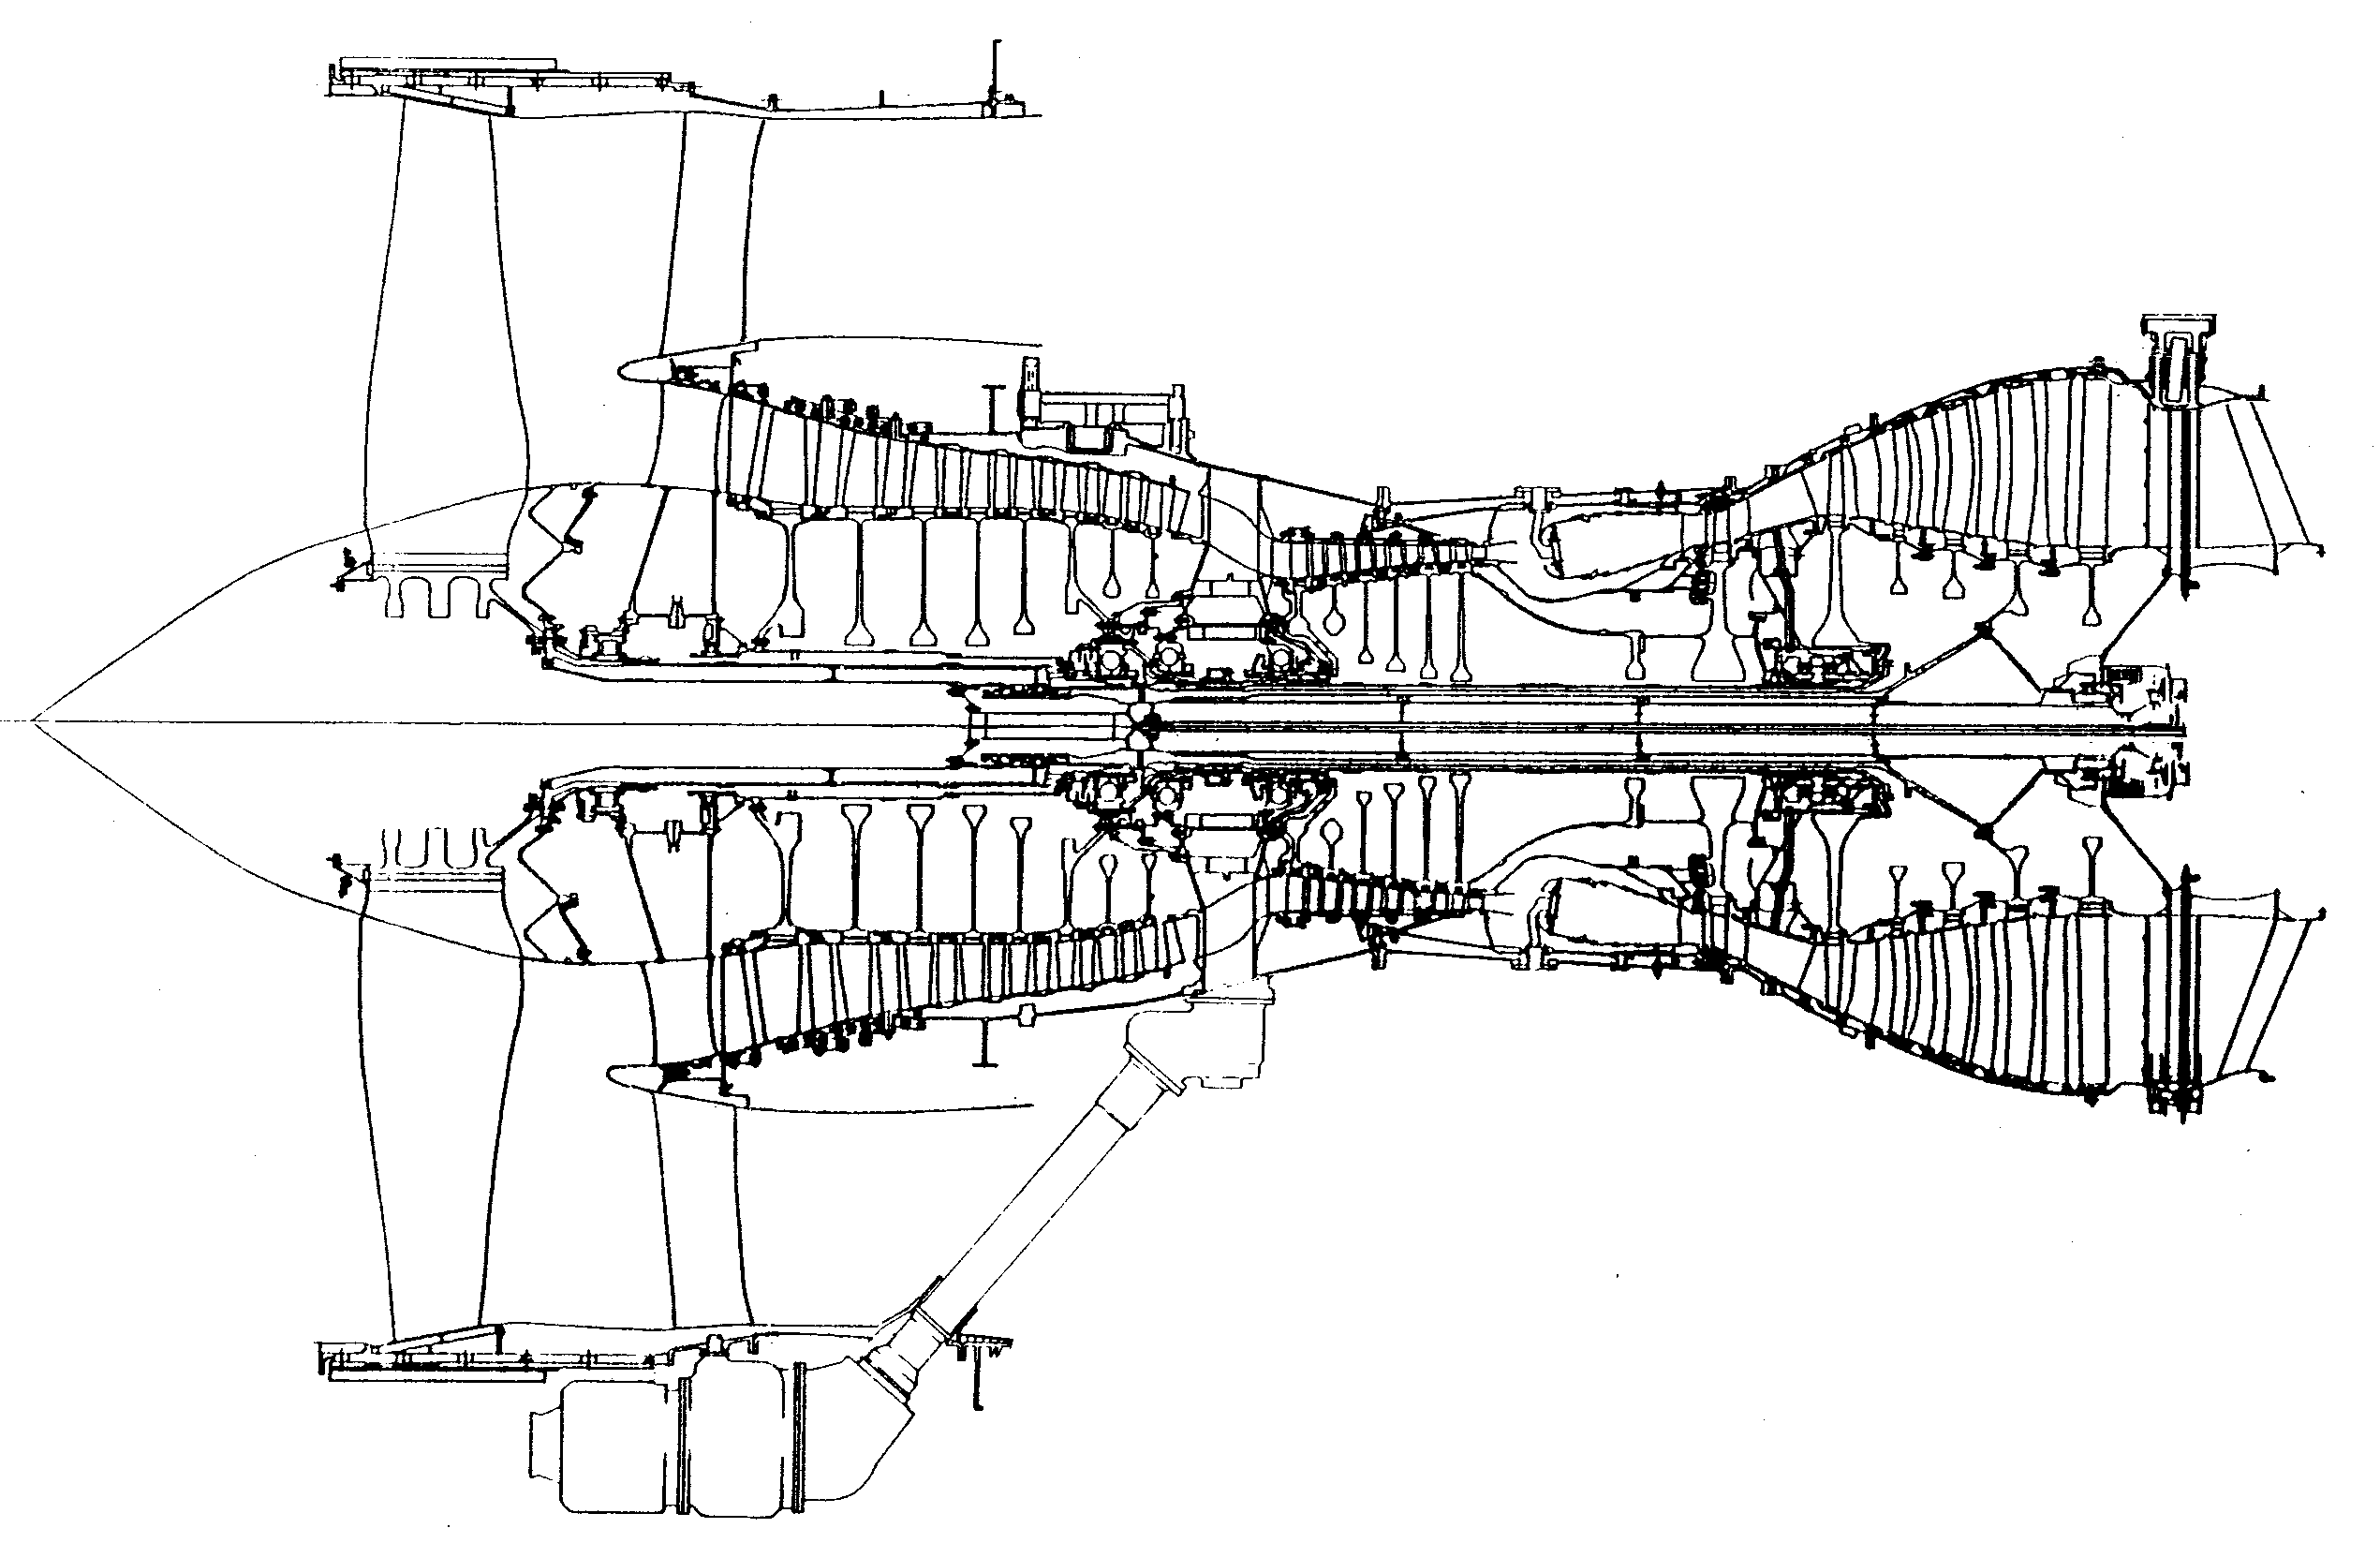 
Figure 1. Stator-well geometries within a high pressure modern gas turbine compressor.
The air in stator-wells is subject to windage shear and this viscous dissipation of energy has to be carried away, or purged, by the leakage flow through the labyrinth seal. Too much flow and the compressor efficiency is penalised, too little flow and overheating can occur. The prediction of the leakage mass flow through the stator-well labyrinth seal is thus of crucial importance and, in order to calculate this, precise knowledge of the seal clearance and therefore metal temperatures is required.
The structure of the leakage flow through the stator-wells is not known with any certainty. There have been few experimental investigations published on this topic owing to the difficulty, complexity and cost of experimental rigs and none have been reported in which the flow velocity has been measured or in which the structure has been observed. In these circumstances the use of a well validated computational fluid dynamics (CFD) code as an investigative tool appears to be well justified.
This paper reports a three dimensional CFD study, using the well known code STAR-CD, of the flow structure, pressure and temperature in a typical compressor stator-well geometry using a two fin labyrinth seal between the two stator wells as shown in the Figure 2. The test cases reported are typical of engine representative conditions. The stator-well problem in its entirety represents a considerable challenge to CFD modelling since it includes three dimensional flow through the compressor stator blades together with interaction between the mainstream flow and the downstream moving rotor blades and also with the leakage purge flow emerging from the upstream stator-well. The non-uniform circumferential pressure field in front of the leading edges of the downstream rotor blades makes the problem three dimensional and time dependent since it is these pressure spikes which drive the leakage purge flow into the downstream stator-well. The time dependent problem is too expensive in terms of computing time at present and the 3D steady flow problem was first split up into several distinct sections to allow the code to be validated against known experimental data for these separate areas.

| ri = inner radius
rr = outer radius
c = labyrinth clearence
Zr = axial distance
|
Figure 2. Datum case stator well geometry.
Although validation of the STAR-CD code is well documented for general flows, the application of any code to rotating flows must be done carefully. Validation was therefore carried out for the following separate cases: the free rotating disc, the closed rotor-stator system, the rotor-stator system with a radial outflow of coolant and for flow through a labyrinth seal. The code uses a finite volume procedure and, in this case, the standard high Reynolds number k-e turbulence model with logarithmic wall functions. The pressure field was obtained using the SIMPLE algorithm. The comparison with experimental results was excellent and gave justification for the application of the code to the full 3D stator-well/stator blade row geometry. The 3D stator blade row problem has been calculated and these results were used initially as boundary conditions for the stator-well geometry itself. A 3D study of the whole stator well domain including stator blades has been carried out by Ozturk et al.1 and the results compared with the axisymmetric solutions. They have showed that axisymmetric solution was capable of adequately predicting the stator-well flow and due to the time consuming nature of the 3D stator-well solution, for some conditions, the axisymmetric solution may be applied to the stator-well flows. It was judged satisfactory and economical therefore to use the 2D axisymmetric program as a design tool, to examine the effect of geometric changes spending the minimum amount of computing time.
Most of the results presented in this paper are for the 2D axisymmetric stator-well case showing the effect of changes on the upstream or downstream well geometries (Figure 3). The results obtained for the different geometries have been compared to the datum case. The effect of labyrinth clearance on the flow structure and flow rate was another object of this study. It has been indicated that due to the pressure rise through the stator blade row, the flow entered radially into the downstream stator well and ejected from the upstream stator well into the mainstream. The traditional core rotational flow has been seen through the upstream stator well for the all cases as shown in the Figure 4. However, the flow structure changed in the downstream stator well due to the effect of the geometry on the flow. It has been seen that decrease of the labyrinth clearance has major effect on the flow rate from the upstream well to the downstream well. There was, however, no significant effect due to geometries change (see Table 1). Generally, it is not possible to reduce of the labyrinth clearance because small clearances cause rubs between the stationary and rotating surface and possibility of the catastrophic damage. Therefore, a3D solution was carried out with a radial fin added to the downstream rotor (Figure 5). It has been noted that adding a radial fin to the downstream rotor has about the same effect as reducing the labyrinth clearance by 50% (Table 1).
The primary findings were that the leakage flow into the downstream stator-well reaches a high level of tangential velocity very quickly, by impacting onto the rotor surface, and that the leakage flow, for a given pressure rise across the compressor stator blade row is governed principally by the labyrinth seal clearance. Any axisymmetric protuberances on the rotor have less effect than was previously thought (although this may not be the case with 3D protuberances such as bolt heads).

| Geometry a: Small rim on rotor inside rim seal.
Geometry b: Small rim on stator inside rim seal.
Geometry c: Downstream rotor extended into downstream stator-well.
Geometry d: Downstream stator extended into downstream stator-well.
Geometry e: Radial fin on the rotor in the downstream stator-well.
Geometry f: Fin on the rotor in the upstream stator-well.
Geometry g: Two fins, deep labyrinth, on the rotor in the downstream stator-well.
Geometry h: Two fins, shallow labyrinth, on the rotor in the downstream stator-well.
|
Figure 3. Different geometries.

Figure 4. Vector plot of stator well flow for the datum case.

Figure 5. A radial fin added to the downstream rotor.
Table 1
Variation of mass flow from downstream stator well to the up stream stator well with changing the stator well geometry and clearance of the labyrinth between downstream and up stream
|
|
Mass Flow (kg/s) |
Fraction of Leakage Reduction |
|
Datum case |
0.071355 |
1 |
|
Geometry a |
0.064616 |
0.90555 |
|
Geometry b |
0.075495 |
1.05803 |
|
Geometry c |
0.069005 |
0.96705 |
|
Geometry d |
0.073142 |
1.02502 |
|
Geometry e |
0.069181 |
0.96951 |
|
Geometry f |
0.066387 |
0.93036 |
|
Geometry g |
0.067465 |
0.94548 |
|
Geometry h |
0.067465 |
0.94308 |
|
3D Solution with fin on downstream rotor |
0.052235 |
0.73203 |
|
Clearance of labyrinth fin=0.37 mm |
0.039077 |
0.54764 |
|
Clearance of labyrinth fin=0.50 mm |
0.049110 |
0.68824 |
REFERENCES
Öztürk, H.K., Childs, P.R.N. and Turner A.B., Numerical Solution of Flow and Heat Transfer in Axial Compressor Stator-Wells, 5th UK National Heat Transfer Conference, London, 1997.
ADAPTIVE SOLUTIONS OF NONLINEAR PARABOLIC EQUATIONS WITH APPLICATION TO HYPERTHERMIA TREATMENTS
Bodo Erdmann, Jens Lang, Martin Seebaß
Konrad-Zuse-Zentrum für Informationstechnik Berlin
Takustraße 7
14195 Berlin - Dahlem, Federal Republic of Germany
erdmann@zib.de
Many phenomena in biology, chemistry, physics, and engineering are set up by time-dependent systems of PDEs which have to be solved numerically under increasingly complex conditions. Typically, the solutions have a dynamic behaviour in space and time. Clearly, in such a situation only adaptive methods are able to control efficiently discretization errors with respect to required tolerances and computational work.
Adaptive hierarchical finite element methods have been developed by the authors to solve problems with highly non-uniform solutions1,2,3. The proposed methods are essentially based on the repeated application of solving discretized equations, error estimation, and local refinement. The final spatial grids are well adapted to the required solution. The reliability of the algorithm has been demonstrated for a variety of chemical problems known to range among the most demanding for spatial adaptivity when thin flame fronts are to be resolved numerically4.
To include more challenging practically relevant problems we extended the above techniques to three-dimensional problems using Finite Elements in space and Rosenbrock methods for temporal discretization. Error estimates utilize p-refinement with superconvergence. Dynamic tree structures are employed to manage grid enhancement and robust coarsening as well.
We apply our method in the field of medical planning for simulation of hyperthermia treatments. Hyperthermia, i.e. heating of tissue to about 430C, is a method of cancer therapy. In most cases electromagnetic waves are used as heat source. Our model of heat transfer within the human body is Pennes' bio-heat-transfer equation (BHTE)
r c ¶ T/¶ t = Ñ (k Ñ T ) - rb cb r W (T-Tb) + ARD
with the density r, the specific heat capacitance c, the thermal conductivity k, the blood perfusion W and the temperature T. The index b is related to blood. The source term ARD describes the absorbed power per volume of the electric field.
For a patient-specific simulation we generate a three-dimensional finite element mesh in which the relevant tissue compartments are represented. Mesh generation is based on a set of computer tomographic scans of the patient5. A discretized part of a patient lying in a radiofrequency hyperthermia applicator is shown in Fig. 1.
This observation is comparable with the results of Tompkins6 for a 2D-simulation of hyperthermia induced by ferromagnetic seeds. Fig. 2 shows an optimized temperature distribution for a tumor which is located in the pelvic.
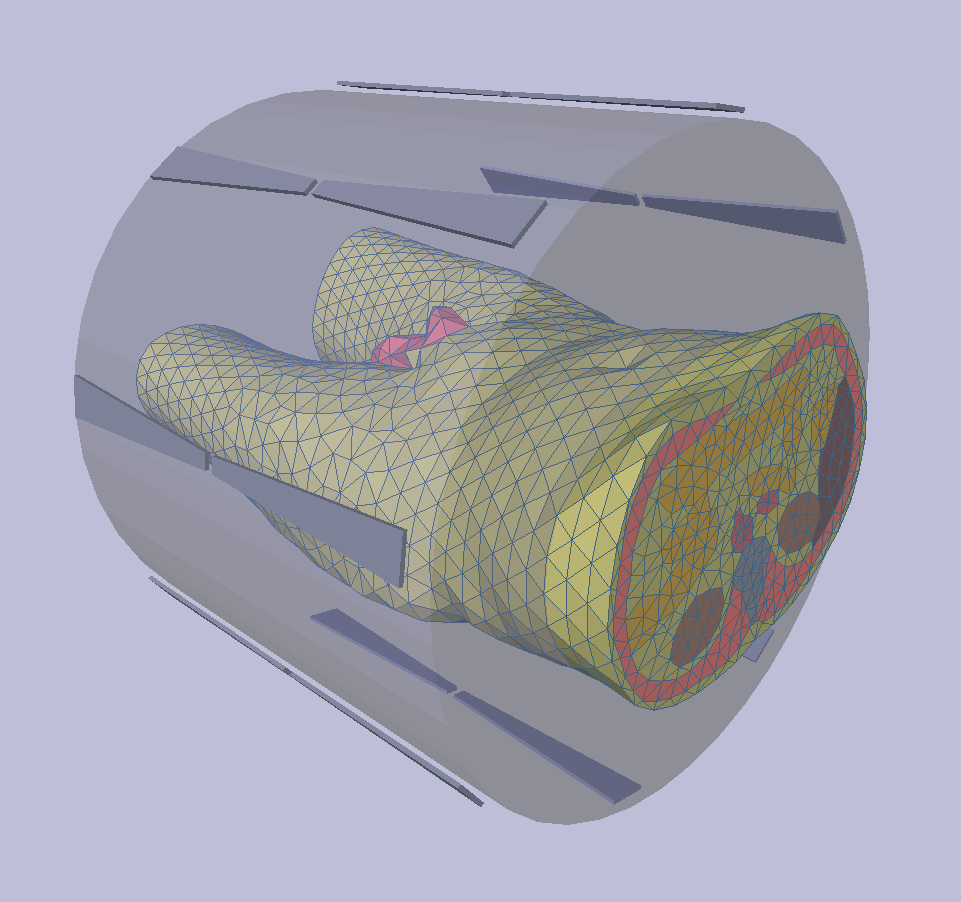
Fig.1: Finite element model for a patient.
In our paper we compare a linear temperature model of the BHTE (constant perfusion W within each tissue compartment) with a nonlinear version (temperature-dependent perfusion). Several simulations reveal that the temperature is significantly higher with a temperature-dependent perfusion.

Fig.2: Optimized temperature distribution.
The implementation of finite element codes in three space dimensions employing adaptive mesh refinement and multilevel techniques requires modern software design and programming languages as C or C++. Our code KARDOS is based on the programming environment KASKADE1. Additionally, a comfortable visualization tool is invaluable. We used the graphical system HyperPlan7 for the presentation of our numerical results.
REFERENCES
- Erdmann, B., Lang, J., Roitzsch, R., KASKADE-Manual, Technical Report TR 93-5, Konrad-Zuse-Zentrum für Informationstechnik Berlin, Germany, 1993.
- Bornemann, F., Erdmann, B., Kornhuber, R., Adaptive multilevel methods in three space dimensions, Int. J. Num. Meth. Engrg., Vol. 36, pp 3187 - 3203, 1993.
- Lang, J., Two-dimensional fully adaptive solutions of reaction-diffusion equations, Appl. Numer. Math., Vol. 18, pp 223 - 240, 1995.
- Lang, J., High-Resolution Self-Adaptive Computations on Chemical Reaction-Diffusion Problems with Internal Boundaries, Chem. Engrg. Sci., Vol.51, pp 1055 - 1070, 1996.
- Seebaß, M., Stalling, D., Nadobny, J., et al, Three-dimensional finite element mesh generation for numerical simulations of hyperthermia treatments. In C. Franconi, G. Arcangeli, and R. Cavaliere (eds.), Proc. of the 7th Int. Congress on Hyperthermic Oncology, Rome,1996.
- Tompkins, D. T., et al, Temperature-dependent versus constant-rate blood perfusion modelling in ferromagnetic thermoseed hyperthermia: results with a model of the human prostate, Int. J. Hyperthermia, Vol. 10, No. 4, 517 - 536, 1994.
- Beck, P. Deuflhard, H.-C. Hege, M. Seebaß, D. Stalling, Numerical Algorithms and Visualization in Medical Treatment Planning, Preprint SC 96-54, Konrad-Zuse-Zentrum für Informationstechnik Berlin, Germany, 1996.
COMPREHENSIVE NUMERICAL SIMULATION OF A DESALINATION PLANT
M.R. Islam and M.Z. Saghir
UAE University, Faculty of Engineering, U.A.E
INTRODUCTION
Reverse osmosis is the most commonly used desalination technique. Research in this area has focused on the development of sophisticated techniques of thin film polymeric membranes that are currently commercialised. Many of the reverse osmosis desalination plants exhibit deviations in quality from the originally designed quality1. It has been revealed that several time-dependent variables are not properly accounted for during the design phase. A comprehensive numerical simulator is essential before an accurate performance prediction can be done. In this paper, a finite element numerical simulator that incorporates all salient features of a desalination plant is presented. Results of the numerical simulator are compared with field observations, with excellent agreements.
PROBLEM FORMULATION
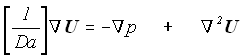
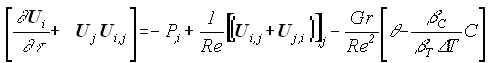
The numerical simulator uses a combination of Navier Stokes equation (for the central tube) and the Brinkman equation for the porous media section2 (hollow cylinder). The flow equations were solved with energy and mass balance equations. Even though temperature change in a desalination plant is not considered to be significant, the energy balance equation was solved for the sake of completeness. A multicomponent adsorption model was incorporated into the porous media section of the simulator3. Adding diffusion and dispersion for both pipe flow and porous media flow completed the model. The governing equations, namely Brinkman equation for flow through the porous medium, Navier Stokes equation for flow through the central pipe, the continuity equation, and the mass balance equation were non-dimensionalized using the following dimensionless groups:
In its dimensionless form, the continuity equation assumes the following form:
Similarly, the momentum balance equation (Brinkman formulation) becomes:
Navier-Stokes Equations:
Conservation of Mass:

Solutal Equation:
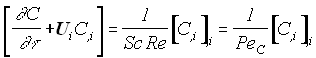
Where  and and are the Schmidt and the solutal Peclet numbers. This transient problem was solved for different time steps using the backward method with variable time interval. The non-dimensional terms such as Reynolds and Darcy numbers are defined as follow: are the Schmidt and the solutal Peclet numbers. This transient problem was solved for different time steps using the backward method with variable time interval. The non-dimensional terms such as Reynolds and Darcy numbers are defined as follow:  , ,
Once the velocities are calculated, the stream function, y
, is computed at each nodal point. Governing equations were solved in dimensionless forms. The model was previously tested for accuracy by comparing results with that of simpler cases. However, for the present case, authors had to rely on the convergence of solutions (a relative tolerance of 10-4 for each variable), because no numerical data on the solution of multi-component coupled numerical simulator are available in the literature.
RESULTS AND DISCUSSION
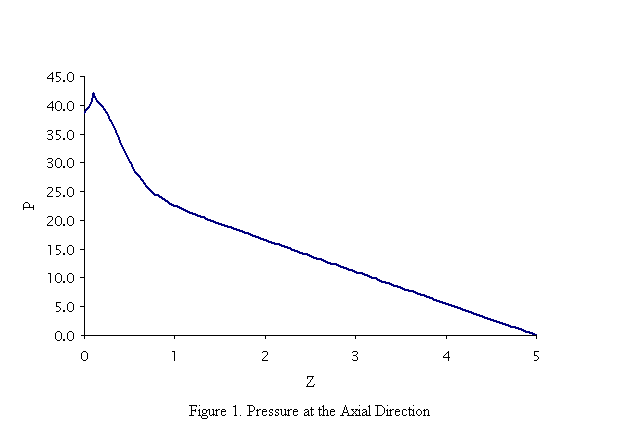
The governing equations were solved for concentration of each component (NaCl and CaCl2 in most cases), pressure, and temperature. The desalination plant of the City of Al-Ain specified the dimension and boundary conditions (inlet/outlet pressure, volumetric flow rate and inlet concentrations). Two parameters were used to history match field data, namely, pressure and NaCl concentration. Field data were collected as a function of distance along the length of the desalination module. A significant difference in quality along the length of the porous media section was observed. This effect could not be simulated if the pressure drop due to pipe flow was not incorporated rigorously. By using the Navier Stokes equation, both the pressure drop and the NaCl concentration at the outlet of the porous medium were calculated accurately. Figure 1 shows the steady-state pressure profile along the length of the desalination cell. Note that the steady was reached only after five days of operation. Once the steady state is reached, the pressure buildup near the inlet (the left-hand side of the plot) is sustained throughout the desalination operation. This is followed by a rapid decline in pressure along the length of the desalination cell. This rapid decline in pressure continues until distance equal to the diameter of the system is reached, following which a linear pressure profile is assumed. In absence of the coupling with the Navier Stokes equation, the non-linear portion of the pressure profile would not exist. Even though a steady state in pressure is reached in five days, it is not the case for the concentration profile. It takes months to achieve breakthrough of the concentration at the outlet. Of course, this follows by saturation of the cell at which point the cell needs to be replaced.
CONCLUSIONS
The numerical simulator is shown to be a powerful design tool. This was done through a series of predictive runs for a wide range of operating conditions. It is shown that minimising the pressure drop along the length would optimise the use of the membrane system. The other option would be to increase the number of inlets so that the pressure gradient in the porous medium is decreased. At present the practice is to discard the membrane if the outlet concentration becomes unacceptable at any point. The simulator also predicted behaviour of a multicomponent mixture. It showed the usefulness of re-designing based on the type of compounds present in the treatment water. Finally, a comparison is made with numerical results that do not incorporate pressure drop along the desalination module and also with the results that do not include multicomponent adsorption. It is clearly shown that the adsorption plays an important role in decreasing the effective life of the reverse osmosis module. Also, not incorporating pressure drop makes the performance predictions unrealistically optimistic.
REFERENCES
- Iwahashi, H. and Nagai, M., 1990, Operation of the Largest Seawater Osmosis Desalination Plant in the World, Bull. Soc. Water. Sci, Japan, vol. 44, pp. 146-151.
- Islam, M.R. and Nandakumar, K., 1990, "Transient Convection in Saturated Porous Layers With Internal Heat Sources", Int. J. Heat and Mass Transfer, vol. 33 (1), pp. 151-161.
- Islam, M.R., and Chakma, A., 1991, "Mathematical Modelling of Enhanced Oil Recovery by Alkali Solutions in the Presence of Cosurfactant and Polymer", J. Pet. Sci. Eng., vol. 5, pp. 105-126.
THREE DIMENSIONAL SIMULATION OF A RECTANGULAR JET
IMPINGING ON A RECTANGULAR HEATED CHIP
I. Sezai and A. A. Mohamad
Mechanical Engineering Dept.
Eastern Mediterranean University
G. Magusa, N. Cyprus,
Mersin 10, TURKEY
ABSTRACT
Jet impingement cooling is an effective method for tempering, annealing of materials, cooling of turbine blades and drying of paper. Also, effective cooling of electronic chips is one of the major problems in managing electronic packaging. Increased power densities per chip have necessitated the exploration of jet impingement cooling. Extensive experimental and theoretical works have been devoted to investigate the effect of geometrical and transport parameters on the effectiveness of jet cooling1-2. These parameters include nozzle size, nozzle velocity, distance between the nozzle and chips, chips temperature, type of the fluid (air, water, dielectric fluids) for single and two phase flow conditions.
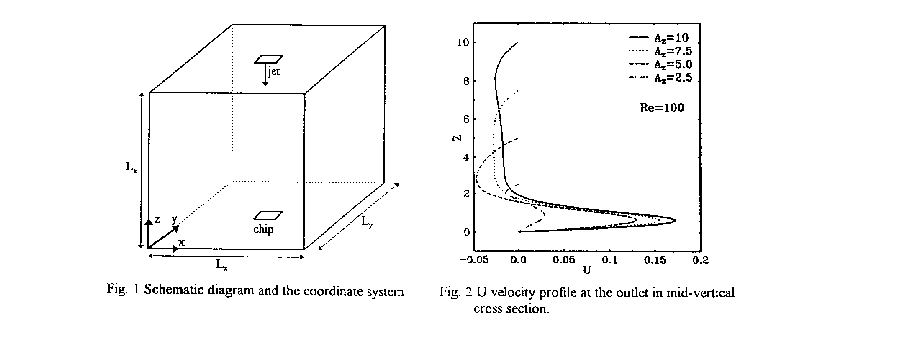
A literature survey indicates that most of the analysis on the jet impingement cooling are based on the assumption that the jet is either axi-symmetric or two dimensional. However, the effect of three dimensionality can not be avoided in real applications. The present work deals with three dimensional, numerical analysis of a rectangular jet, impinging on a finite rectangular chip (Fig. 1). The analysis is performed to investigate the effect of the ratio Lz/Dh , the distance between nozzle and chips to hydraulic diameter of the nozzle. In this work we consider one Reynolds number (Re=100) and a solution domain of Lx/Dh=10, Ly/Dh=10 for four Lz/Dh ratios; namely 10.0, 7.5, 5.0 and 2.5.
The 3-D Navier Stokes and energy equations in nondimensional form for incompressible flows are discretized using finite volume method in staggered non uniform grids in Cartesian coordinates. The buoyancy effect has been neglected. The convection and diffusion fluxes are calculated using QUICK scheme in deferred correction manner with ULTRA-SHARP3 flux limiter strategy. The Bi-CGSTAB4 iterative method with SSOR preconditioning is applied to the pressure and energy equations in the sequential procedure of the SIMPLE algorithm. A grid systems of 51x51x51 is used for the solution domain. An underrelaxation factor of 0.5 is used for momentum and energy equations in all calculations. Iterations are continued until the second norm of the residuls for all equations reduced below 10-6 where it takes about 1000 iterations to achieve this condition.
No slip boundary condition is used for the top and bottom solid walls. The first derivative of all velocity components are set equal to zero at the exit of the solution domain. The fluid moving from the outside into the computational domain at the exit has the ambient temperature and for the fluid moving out, the first derivative of temperature is set equal to zero. Adiabatic boundary conditions are imposed on the top and bottom plates except the chip which is set to a higher temperature than the ambient. The jet temperature is set to that of ambient.
SAMPLE OF RESULTS
For Reynolds number based on hydraulic diameter of the nozzle, the following results are presented for forced convection. Figure 2 shows U-velocity profiles at the outlet, in mid-vertical cross section, where wall jet formation is evident.Figure 3 a, b and c shows contours of W-velocity (vertical component of velocity) profiles at different horizontal planes, near exit of the nozzle, at mid-plane and near the heated chip, respectively. It is interesting to notice from Fig. 3, that although the nozzle cross section is rectangular, the jet diffuses into a circular form away from the nozzle exit. This is due to flow entrainment from the surrounding fluid and the effect of momentum diffusion reduces sharp gradients at the edges of the rectangular jet.Fig. 4 a, b and c shows W-velocity on the horizontal plane, corresponding to profiles of Fig. 3. As expected, the core jet velocity decreases as the jet approaches the heated chip.
Fig. 5 shows that surrounding fluid is entrained into the system from the top. This is due to the fact that high jet flow velocity reduces pressure and forces the flow to be entrained into the jet. These findings are consistent with experimental observations, that the flow for jet impingement can be classified into three regions, potential jet, impingement region and wall jet. Figure 6 illustrates the Nusselt number variation on the chip surface which is assumed to be flush with the bottom plate.
REFERENCES
- Potthast, F., Laschefski H. and Mitra, N. K., Numerical Investigation of Flow Structrure and Mixed Convection Heat Transfer of Impinging Radial and Axial Jets, Numerical Heat Transfer, Part A, Vol. 26, pp 123-140, 1994.
- Lin, Z. H., Chou, Y. J. and Hung, Y.H., Heat Transfer Behaviors of a Confined Slot Jet Impingement, Int. J. Heat Mass Transfer, Vol.40, pp 1095-1107, 1997.
- Leonard, B. P. and Mokhtari, S., Beyond First Order Upwinding: the ULTRA-SHARP alternative for Nonoscillatory Steady-State Simulation of Convection, Int J. Numer. Methods Eng., vol. 30, pp. 729-766, 1990.
- Van der Vorst, H. A., BiCGSTAB: A Fast and Smoothly converging variant of Bi-CG for the Solution of Non-Symmetric Linear Systems, SIAM J. Sci. Statist. Comput., Vol. 10, pp. 1174-1185, 1989.

|
